Finding a bug in Chromium
This week I’ve submitted a report for a bug I found in Chromium, the first time I’ve done so. I wanted to show how I found the bug and to spread the word … to hopefully speed up the resolution of it.
At Monumental we’re building robots to automate construction, starting with masonry. At our company full-stack really means full-stack, it reaches from the hardware and electronics all the way to the front-end that designs the walls and controls the robots.
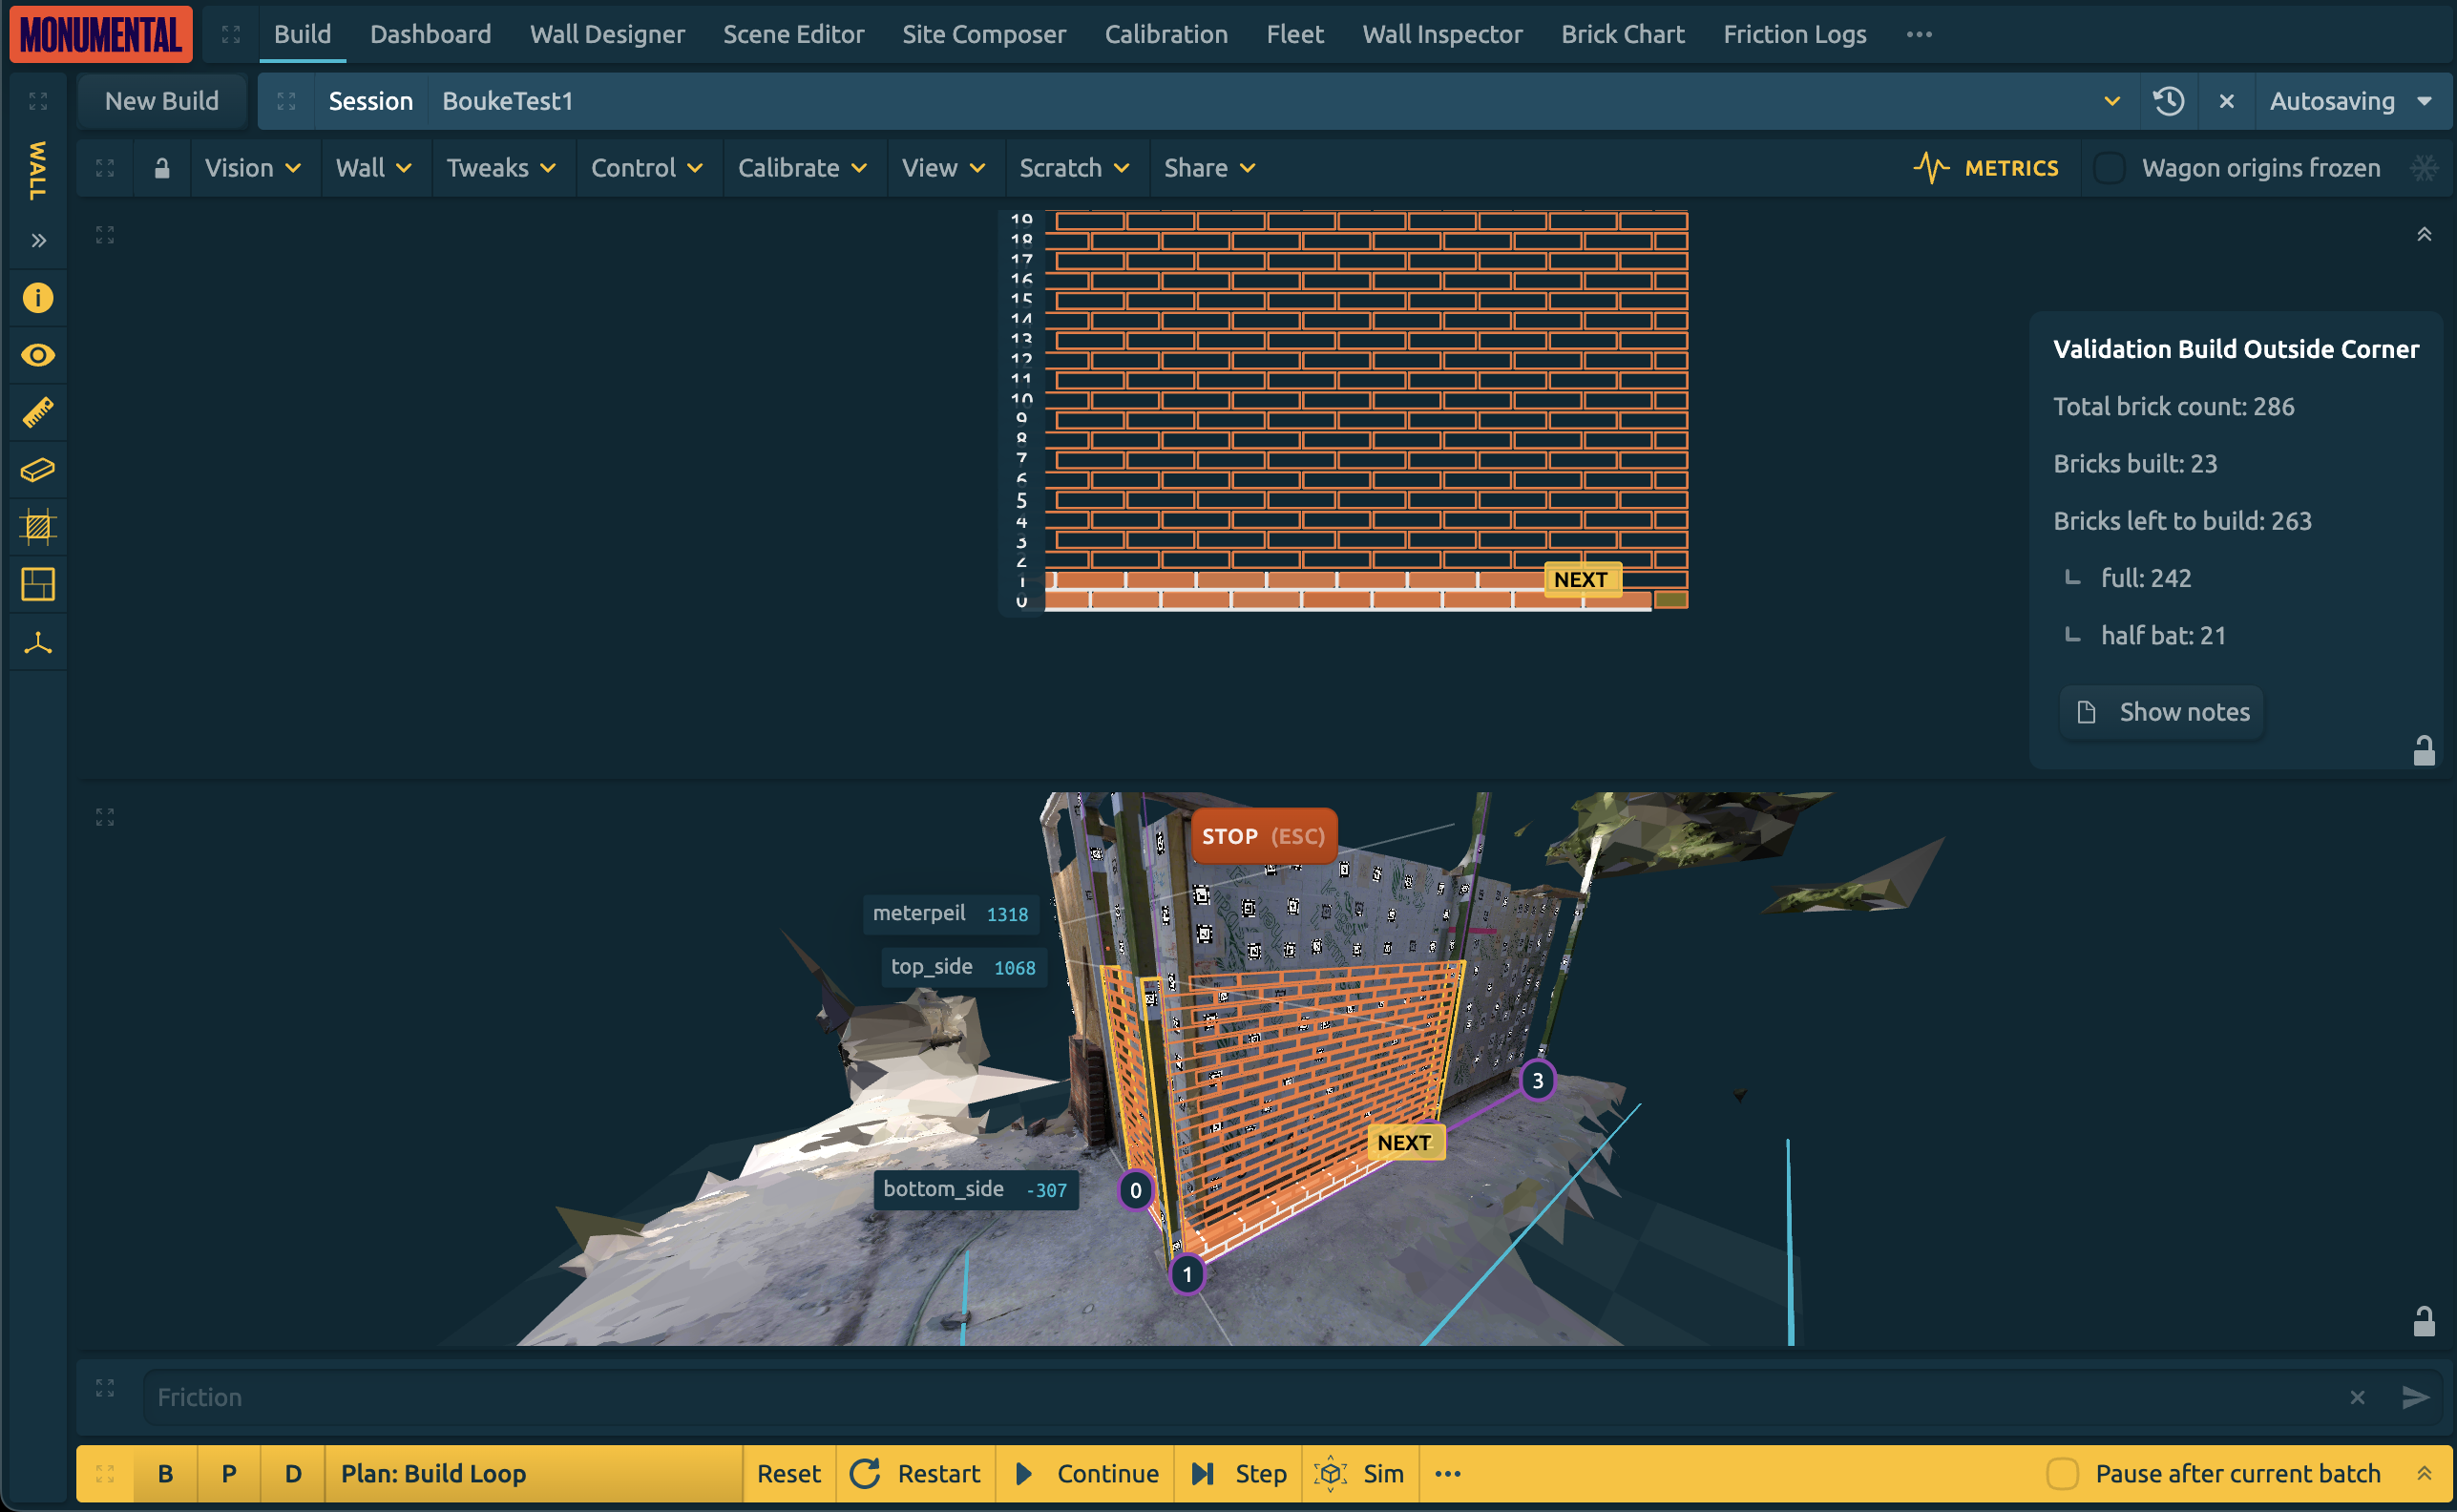
Our frontend is an Electron app called Atrium that we develop using a mix of TypeScript and Rust WASM code. We use Rust because it allows us to have a shared codebase between our frontend and backend—the ‘backend’ being the code that runs on the robots in this case. To use Rust from TypeScript we use wasm-bindgen, which represents Rust objects as wrapped JS classes, essentially a pointer to some memory with generated methods.
To ensure Rust memory is released when the JS pointer to it is no longer referenced, wasm-bindgen uses the Weak References support in modern JS engines to register cleanup callbacks in a FinalizationRegistry. This allows you to register a function (a finalizer) that is called after an object is garbage collected.
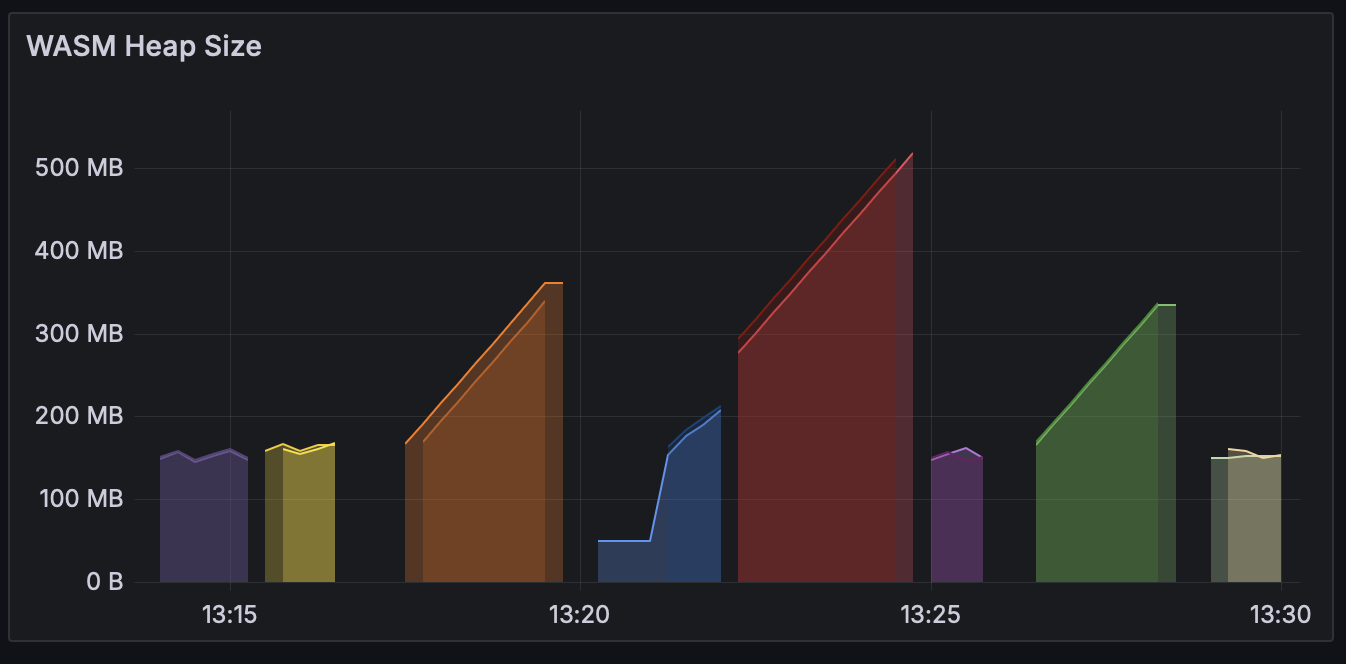
The problem we have is that sometimes our WASM memory starts rising and never falling again. Strangely it only happens sometimes and seemingly without any relation to the current page or what the operator was doing at the time. Looking closely at the metrics I realized the first crucial thing: once this runaway memory leak started happening, it would keep happening for a specific window, across reloads. The only way to resolve it would be to close the window and open a new one.
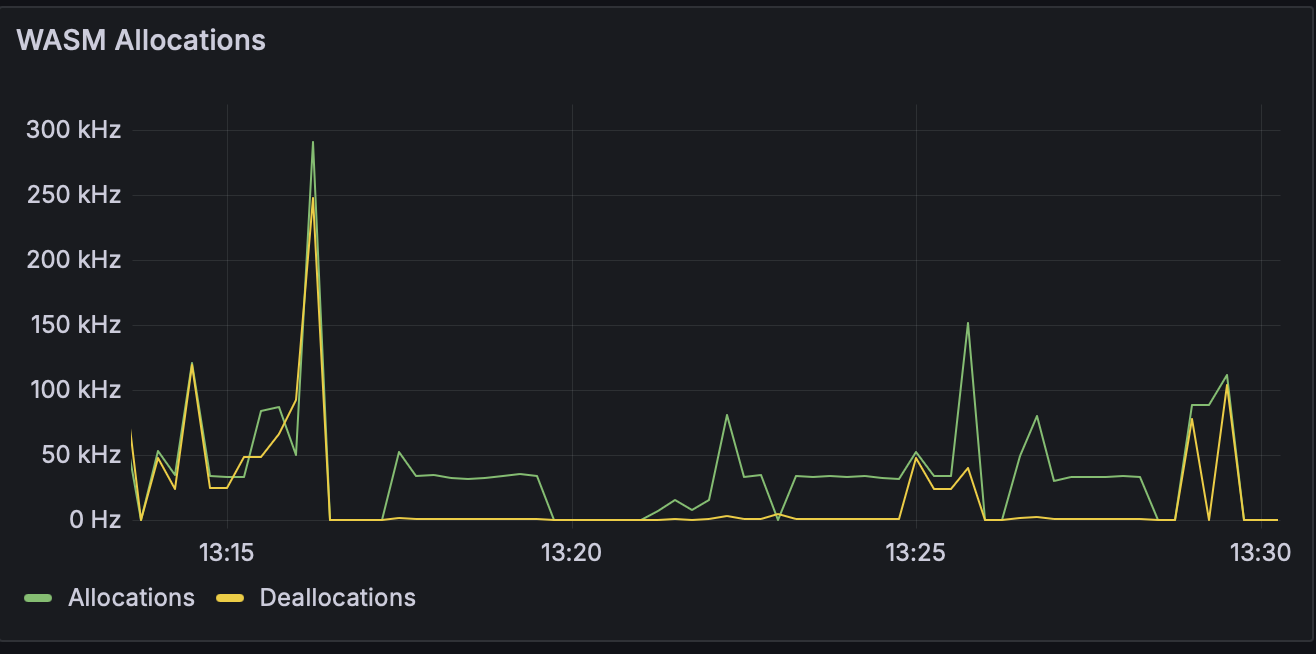
I kept adding more metrics around our WASM usage until I pinpointed the exact thing that was happening: at some point the JS engine would just stop calling finalizers. And this behavior persists across reloads.
Creating a reproduction
At this point I was quite sure I’d found a browser bug, because the behavior seemed to happen randomly and because of the persistence across reloads. Now I had to create a reproduction, which was a bit daunting because we have a complicated app using many browser features like workers, SharedArrayBuffers, who knows what underlying interaction causes this issue. And I had to reproduce it outside of the context of our Electron app, because it wouldn’t get accepted by Chromium otherwise. After some fiddling I managed to create a minimal reproduction, all you have to do is insert a lot of objects into a FinalizationRegistry and reload the tab a couple of times and then it mysteriously starts happening. This is the whole reproduction:
let liveObjects = 0
let createdObjects = 0
let collectedObjects = 0

const registry = new FinalizationRegistry(() => {
    liveObjects--
    collectedObjects++
})

class TrackableObject {
    constructor(id) {
        this.id = id
        this.data = new Uint8Array(5_000)
    }
}

function createObject() {
    for (let i = 0; i < 20_000; i++) {
        registry.register(new TrackableObject(i))
        createdObjects++
        liveObjects++
    }
}

setInterval(createObject, 1_000 / 60)

setTimeout(() => {
    if (collectedObjects > 0) {
        window.location.reload()
    }
}, 3000)
After a couple of reloads (you can speed up the process by refreshing a couple times yourself) the collectedObjects value gets stuck at 0 and the runaway memory leak has manifested itself. You can try it here, it works in Chrome Canary as of May 2nd 2025 (version 138.0.7156.0).
Resolution
Usually when there’s a bug in open-source software I’d take a stab at resolving it myself, but Chromium is one of the most complicated pieces of software that’s our there, with over 30 million lines of code. This bug also smells a lot like a race condition, which are also hard to fix. So I’m just gonna hope submitting the bug to the bug tracker will get it fixed in the not too distant future!
Does pushing the limits of what browser engines until they break excite you? Come work with me!
May 2025